
What do I mean by that?
Simple. We are fond of reporting facts.
“X number of units sold.”
“20% increase in sales.”
But what does that mean?
Not much.
And, as it relates to COVID-19 reporting, simple numbers generally make the reporting seem even worse.
I’m sure you all get updates on COVID-19 via the news or your social media streams. Most of the time it is bad news. How could it be good news when you’re reporting the number of fatalities and people in ICU? It is bad news and it seems like it is just getting worse.
But I had a small ray of sunshine punch through the clouds when I saw a post on Facebook about COVID-19 in Ohio. The text from the post is this:
Huge news OHIO, 7 straight DAYS!!!!! Below the OSU model curve. Today’s cases are less than 1/3 of the predicted and less than yesterday.
A projected curve of new cases from Ohio State University predicted Ohio would have 1,063 new coronavirus cases Sunday. The state reported 304 new cases, putting Ohio below the Ohio State projection curve for seven days in a row.
The image that accompanied it was this:
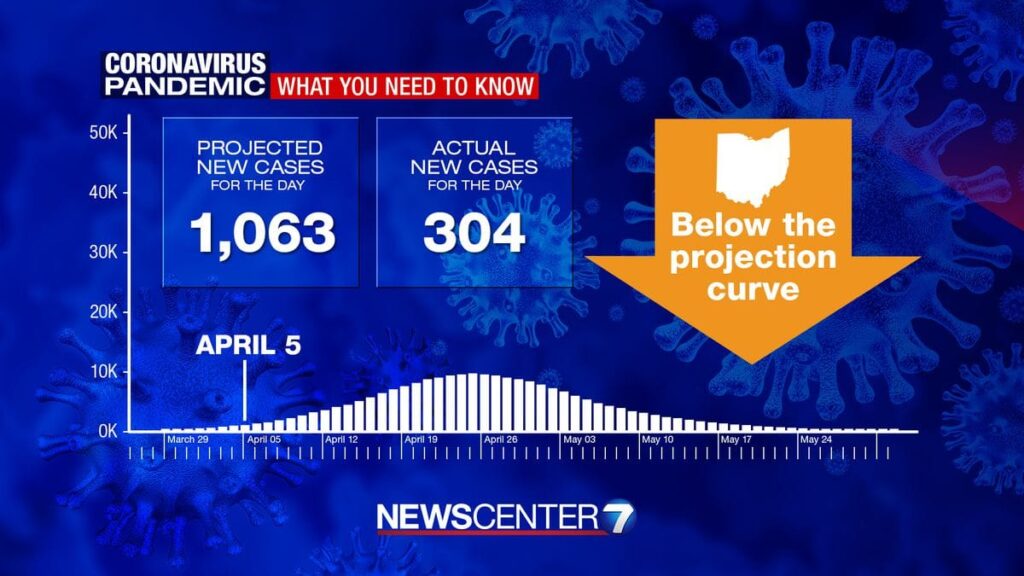
While the news is still bad – 304 new cases reported. It was far less than the projection of 1,063. The implication is the work the people in Ohio are doing to flatten the curve and reduce transmission is working GREAT!
THAT is the news. THAT is the metric.
How many people will see this as hopeful news versus simply seeing another 304 new cases? Reporting the difference between expected cases and actual is a huge piece of good news reinforcing that the behaviors we know work are working! In the other case, is just a number that can suggest we still aren’t at zero, so things must not be working.
I don’t know why we don’t do more of this in our national reporting – it could have a huge impact on the number of people who follow physical distancing, masks and gloves recommendations. If we see it working, we’re more likely to keep doing it. Simply seeing the number doesn’t generate that influence.
Don’t report just the metric. Think of the context. Think of the way it relates to your end goals.
Ohio has it knocked I think. We should be looking to them for guidance on how to put a cover on this shite.
I would even have the graphic show a huge gap between estimated and actual to reinforce beating the estimate by almost 60%! (We know people don’t read anymore.)
Just something to ponder as you look at your program in today’s new normal.
A 20% drop may seem huge in a normal year but maintaining 80% of your sales is a HUGE accomplishment mid-COVID-19. HUGE accomplishment. Talk about THAT!


Recent Comments